
Code Score is a collaborative effort led by Hazel Borys and Kaid Benfield that compiles the work of many study authors to track the impacts of form-based codes and compact, mixed-use development patterns. As of September 2019, we’ve tracked 135 studies that measure these impacts.
The purpose of land use laws is to protect the health, safety, and welfare of people and the environment as cities and towns are built then redeveloped over time. When zoning tries to control something other than detractors or contributors to these factors, it is likely to be repealed.
However, once land use laws pass their initial logic tests and are adopted, few tools exist to measure if zoning codes are delivering on their purpose.
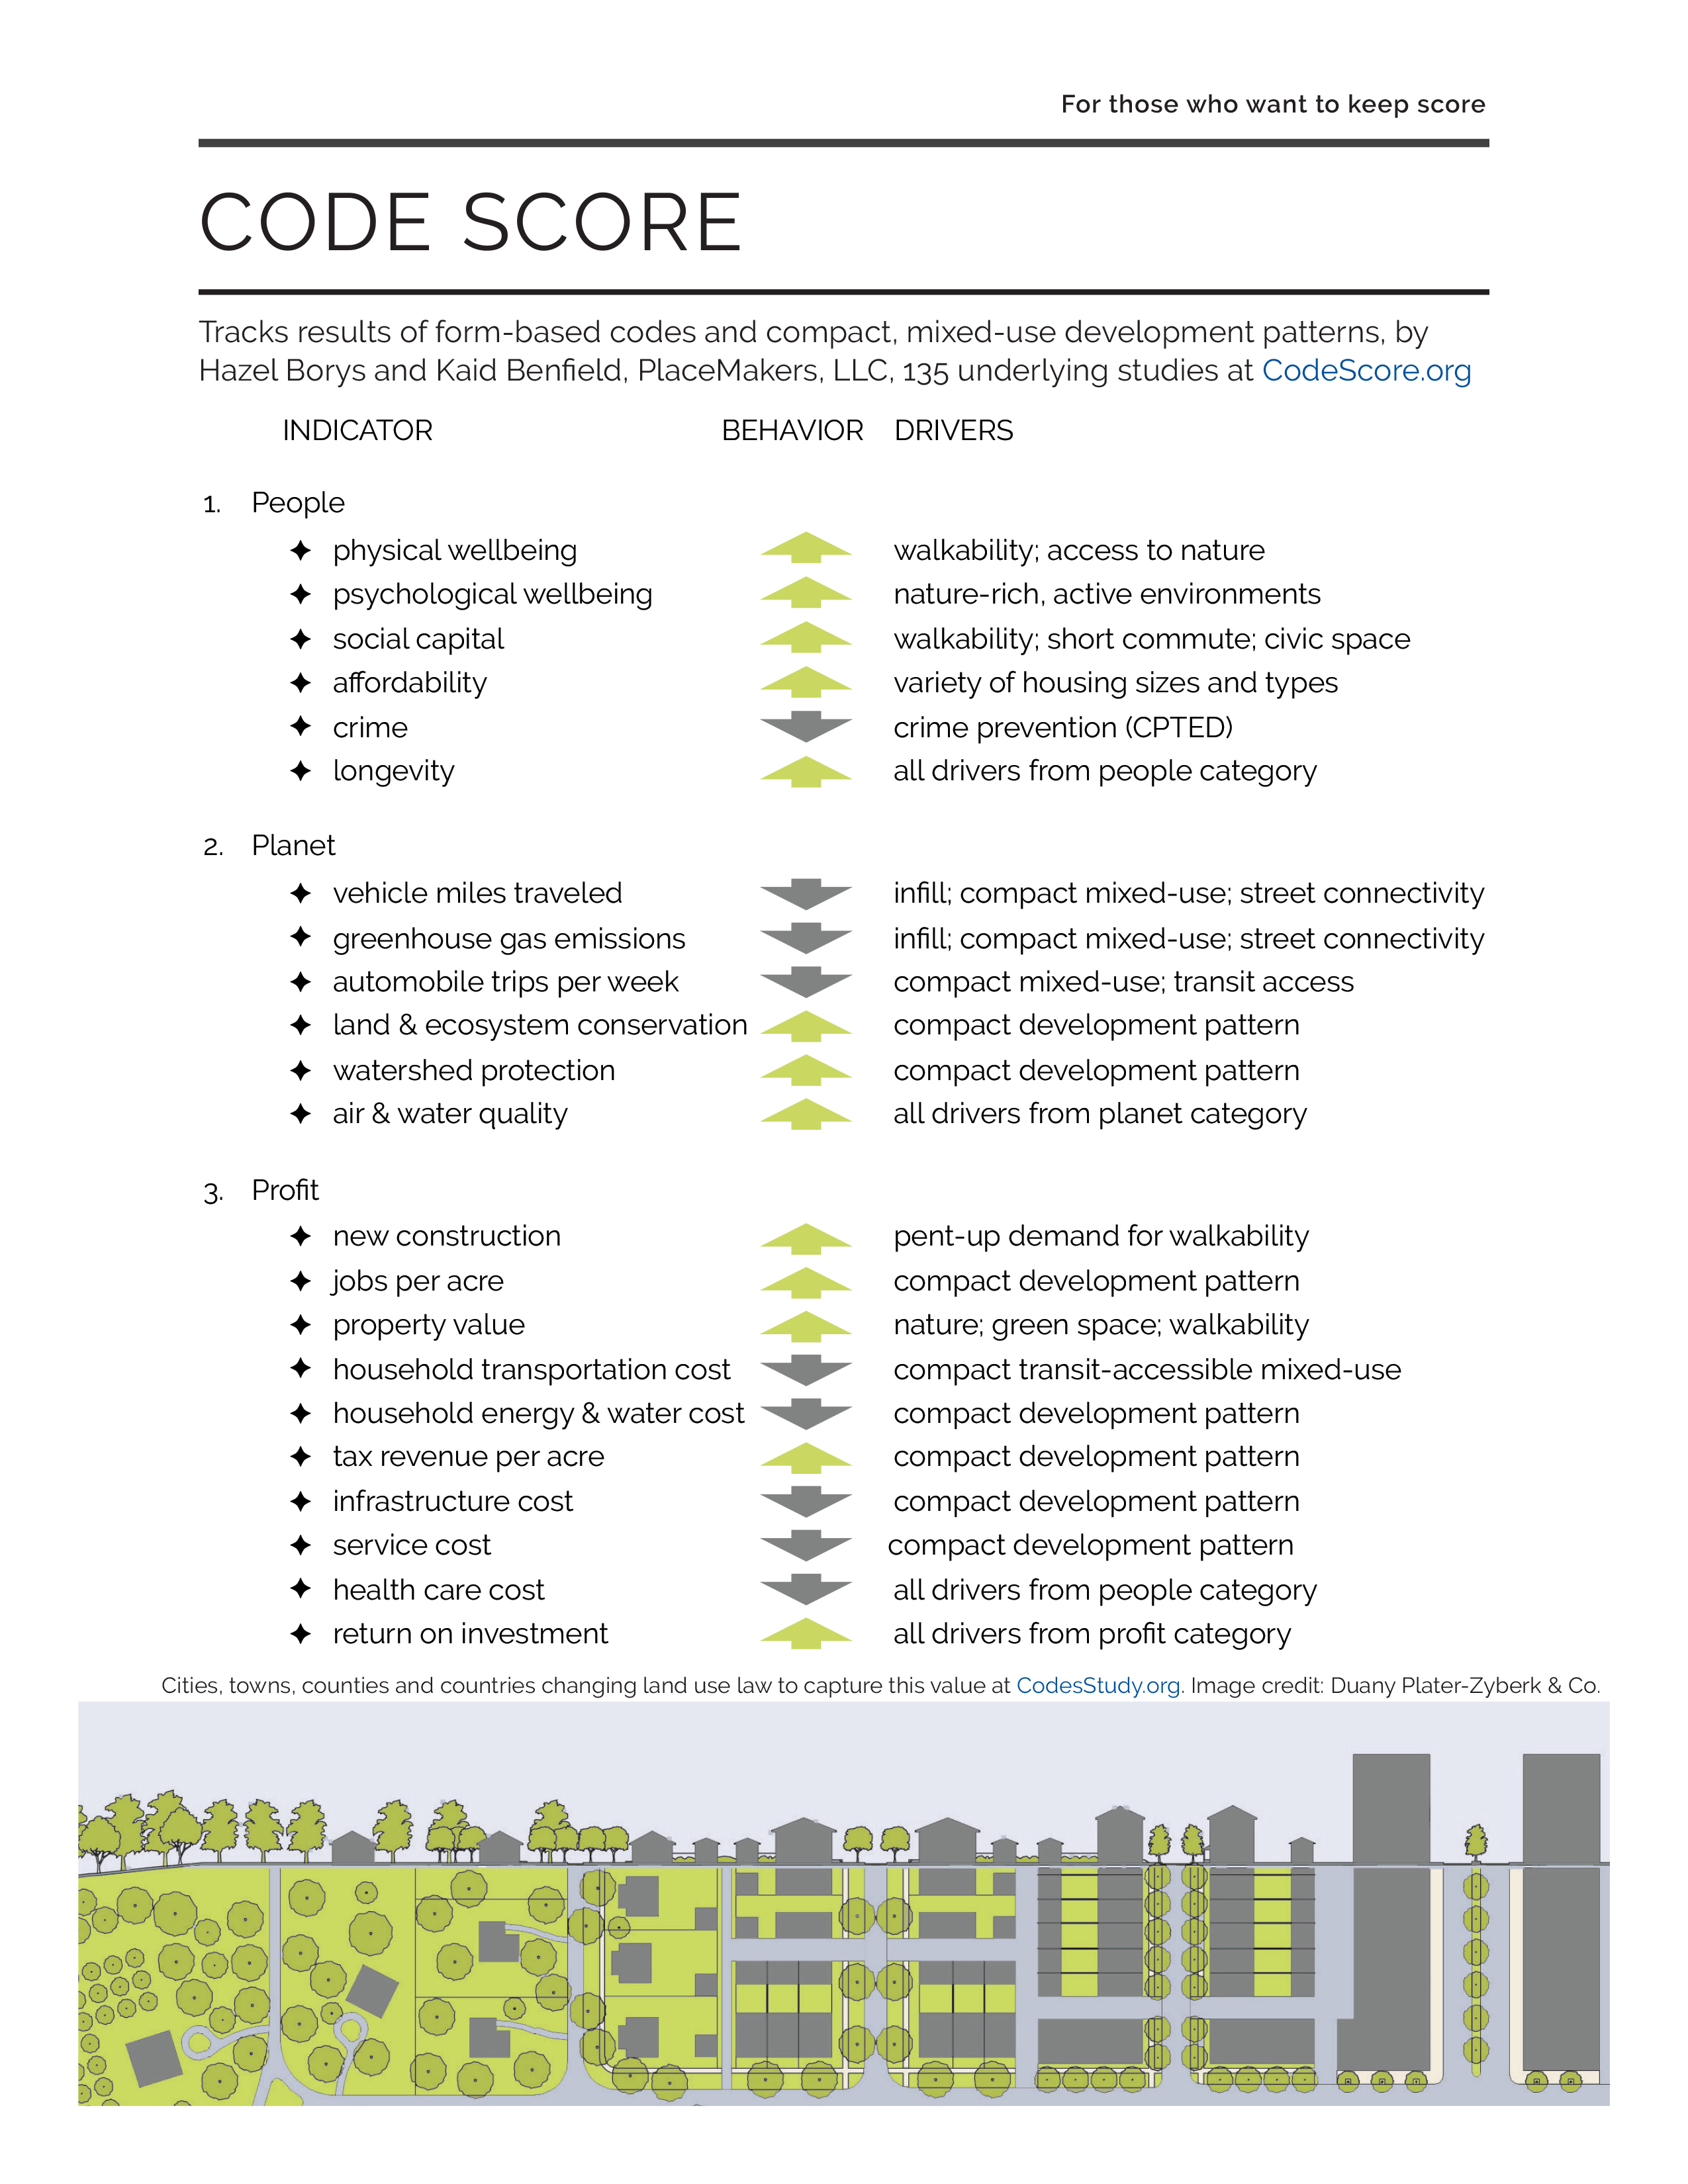
Code Score consolidates 135 peer reviewed studies that link urban form to paybacks to health, safety, welfare, and the environment under the categories of people, planet and profit. Then these impacts are grouped by how drivers affect indicators for high-functioning zoning codes.
Table of Contents
Building City Coffers: Increased Tax Base and Decreased Costs
Building Wealth: Commercial and Home Values
Building Wealth: Market Preference
Building Wealth: Cycling and Walking
Reducing Costs of Illnesses: Obesity and Overweight
Form-Based Code Individual Case Studies
Building Connections: Social Capital
Building Health: Cycling and Walking
Building Health: Nature and Urban Form
Building Supply: Market Preference
Decreasing Emissions: Cycling, Walking, and Transit
Decreasing Emissions: Land Development Patterns
Increasing Water Quality: Compact Development
SCORE CARD
Code Score is a companion piece to Codes Study, which tracks zoning codes that comply with Form-Based Code Institute criteria, putting priority on form, for how buildings and streets shape the public realm. The direction of indicator movement in the score card below is for these form-based codes, which put rules in place to encourage livability and well-being in the built environment.
Code Score: the 135 studies that articulate the reasons
why urbanism generates strong returns
The following 135 studies inform the score card above. While Code Score is primarily authored by Hazel Borys and Kaid Benfield, it receives public comment and input via this Google Sheet. Here, you will find the same summaries of and links to the underlying studies as listed below, categorized by their strongest contribution: people, planet, or profit, as well as which of the elements of well-being are effected. If you prefer the information below in a sort-able spreadsheet, the study summaries and links may be downloaded from the Google Sheet by selecting file; download; Microsoft Excel.
PROFIT
Building City Coffers: Increased Tax Base and Decreased Costs
Urban mixed-use mid-rise is 25 to 59 times more revenue per acre than its suburban counterparts. (Joe Minicozzi; Urban3, 2010)
London, Ontario estimates sprawling development patterns will cost an extra $2.7 billion in capital expenditures plus $1.7 billion in operating expenses over compact growth, or $4.4 billion extra over 50 years. (City of London, Ontario, 2013)
Smart growth development generates 10x more tax revenue per acre than conventional suburban development and costs less by an average of 10% on ongoing delivery of police, ambulance and fire services; Income per acre is as high as 1,150 times more under Nashville's downtown form-based code, compared to suburban counterparts. (Smart Growth America, 2013)
Increasing the level of walking connectivity in Melbourne by 10% estimated to add $2.1 billion to the economy. (SGS Economics & Planning; City of Melbourne, Australia, 2018)
Trees saves big cities about $505 million each year. (T. Endrenya, R. Santagatab, A. Pernab, C. DeStefanob R. F. Rallob, S. Ulgiatib; Ecological Modeling, 2017)
Calgary estimated compact development will save the City $11 billion in infrastructure costs, making it 33% less costly to build the roads, transit, water, recreation, fire, and schools that it expects to need over the next 60 years. (City of Calgary, 2009)
Halifax's annual cost per household is more than two times more per suburban households than for urban. (Halifax Regional Municipality, Nova Scotia, 2005)
An EPA-sponsored study indicates compact infrastructure is up to 47% less expensive than conventional development patterns. (Jonathan Ford; Morris Beacon, 2010)
Emotional connection to community equals highest rates of GDP growth. (Knight Foundation & Gallup, 2011)
While suburbs are growing 160% faster than cities in Canada, suburban dwellers pay only half the cost of roads that city dwellers pay. (Smart Prosperity Institute, 2013)
Auckland’s city centre has half a million walking trips every weekday and traffic delaying pedestrians in Queen Street can cost $11.7 million a year. (Auckland Council's Research and Monitoring Unit, 2018)
Cities can save $17 trillion by preventing urban sprawl. (Global Commission on the Economy and Climate, 2018)
Building Wealth: Commercial and Home Values
If your Walk Score increases from 60 to 80, that increased walkability translates into a $100,000 home price premium. (Redfin, 2016)
Homes in walkable urban neighborhoods have experienced less than half the average decline in price from the housing peak in the mid-2000s. (Brookings, 2010)
A 10-point increase in Walk Score increases commercial property values by 5% to 8%. (Gary Pivo, Jeffrey Fisher; Indiana University, University of Arizona, 2010)
Over time in D.C. metropolitan neighborhoods, each step up the walkability ladder adds $9 per square foot to annual office rents, $7 per square foot to retail rents, over $300 per month to apartment rents, and nearly $82 per square foot to home values. (Chris Leinberger, Mariela Alfonzo; Brookings Institute, 2012)
A one-point increase in Walk Score (based on number of destinations within a short distance) is associated with between a $700 and $3,000 increase in home values. (Joe Cortright, Impresa, Inc.; CEOs for Cities, 2009)
Building Wealth: Market Preference
U.S. companies are gravitating to walkable downtown neighborhoods, from the very small to the Fortune 500. These moves include relocations, consolidations, and expansions to places with considerably higher Walk Scores, Transit Scores, and Bike Scores from where the businesses were previously located. Companies are making their move downtown to attract and retain talented workers, to build brand identity and company culture, to support creative collaboration, to be closer to customers and business partners, to centralize operations, and to support the triple bottom line. (Smart Growth America; Cushman & Wakefield; George Washington University School of Business’ Center for Real Estate and Urban Analysis, 2015)
66% of Americans believe that investing in schools, transportation choice, walkability, and key community features is the best way to strengthen the economy. Less than 10% of the massive Millennial and Boomer Generations want traditional, auto-dependent suburban living, even though over 40% live there today. "Economics of place" is likely to drive economic growth and development, with traditional business recruitment strategies seen as less important than investing in local amenities and quality of life. (American Planning Association, 2014)
Americans prefer walkable communities more so than they have in the past. 79% place importance on being within easy walking distance of neighborhood destinations. (National Association of Realtors, 2015)
All national retailers pay attention to Walk Score, often requiring a score of 80 or higher to consider adding a new store downtown. However, in the 51 largest U.S. metro areas, only 12% of neighborhoods are walkable, which is down from 19% in 1970. The 50/50/50 rule says that Main Street retail’s ideal sweet spot enjoys at least 50,000 people earning at least $50,000 per year, or 50,000 cars going by a store. (Bob Gibbs, 2011)
Trying to build a downtown out of just specialty shops does not work because form follows anchor. Only about 30,000 square feet of retail is supportable without an anchor. An anchor may be a baby box retailer as well as non-retail amenities. A library, post office, and courthouse are all strong civic anchors. In most places, the anchor pays half the rent of in-line stores, in exchange for their big advertisements and draw. (Bob Gibbs, 2011)
Suburbs are still growing faster than cities in Canada. (Dr. David Gordon, 2016)
The rising Millennial generation coupled with the retiring Baby Boomers make up half of the U.S. population, and are driving the demand for a walkable urban alternative in downtowns. Across North America, downtown residents are frequently younger and better educated, and being close to work and public transit are their top two reasons for living downtown. (Smart Prosperity Institute, 2013)
This trend toward more new jobs in city centers, with employment growth shrinking in the suburbs, has built up momentum in the last several years. Businesses are choosing to locate in walkable locations, to attract younger workers who prefer a less car-dependent, more urban lifestyle. (Joe Cortright; City Observatory, 2015)
Property values within walking distance of public transit stations are 40% higher than other properties in the same region. (American Public Transportation Association, 2013)
Millennials are 21% more likely to buy their first homes near city centers than Generation X. (Elora Raymond of Clemson University, Jessica Dill of the Federal Reserve Bank of Atlanta, Yongsung Lee of Georgia Institute of Technology; Journal of Planning Education and Research, 2018)
Building Wealth: Cycling and Walking
One mile on a bike is a $.42 economic gain to society in Copenhagen, while one mile driving is a $.20 loss. (City of Copenhagen, 2012)
Reallocating 2% of Portland's streets to transit and cycling would boost the people-moving capacity by 60%. (Siteline Institute, 2018)
Biking saves U.S. riders billions a year. Average annual operating cost of a bicycle: $308. Average annual operating cost of a car: $8,220. Between 2000 and 2010, the number of bicycle commuters grew 40% in the US. The average American household spends more on transportation (16%) than on food or healthcare. Low-income families may spend up to 55% of income on transportation when they live in auto-centric environments. (Forbes, 2012)
This guide to be an accessible and useful statement of the basic research theory behind the Center for Neighborhood Technology (CNT) Housing and Transportation Index (H+T Index). Under the traditional definition of housing affordability (30% or less of household income spent on housing), seven out of ten U.S. neighborhoods are considered “affordable” to the typical household. But in almost all metro regions of the country, when the definition of affordability includes both housing and transportation costs—at 45% of income—the number of neighborhoods affordable to households earning the area median income decreases significantly. Nationally, the number of affordable neighborhoods declines to 40 percent, resulting in a net loss of 48,000 neighborhoods with combined housing and transportation costs that stress the average family’s budget. An important tidbit in CNT’s classic graphs correlating a decrease in driving with an increase in density (as well as graphs from other sources showing the correlation) is that the greatest incremental improvements in performance - the greatest reductions in per-household driving - come at the lower end of the scale, as one moves from large-lot sprawl to moderately sized lots in more compact neighborhoods. In particular, the graph shows a dramatic drop in driving as one moves from one household per acre to ten households per acre; a more gradual decline between ten and twenty households per acre; and almost negligible decreases for additional density beyond twenty households per acre. We do not need large increases in density to make a difference. (Center for Neighborhood Technology, 2010)
The biggest difference between spenders and savers is car expenses. (Raj Chawla; Ted Wannell; Statistics Canada, 2005)
Eliminating one car from a typical household budget can allow that family to afford a $100,000 larger mortgage. (Patrick Doherty, Christopher Leinberger; Brookings Institute, 2010)
$10 saved for each 10 mile commute. (Mr. Money Mustache, 2011)
Building Wealth: Nature
This academically rigorous review of 86 peer-reviewed studies published since 2000 shows that parks contribute to human and social wellbeing via 1) biodiversity (as measured through species richness); 2) property prices; 3) physical activity and reduced obesity; and 4) local cooling. “Nature and green spaces contribute directly to public health by reducing stress and mental disorders, increasing the effect of physical activity, reducing health inequalities, and increasing perception of life quality and self-reported general health. Indirect health effects are conveyed by providing arenas and opportunities for physical activity, increasing satisfaction of living environment and social interactions, and by different modes of recreation ... “The direct health benefits for which we found evidence on positive effects included psychological wellbeing, reduced obesity, reduced stress, self-perceived health, reduced headache, better mental health, stroke mortality, concentration capacity, quality of life, reduced Attention Disorder Hyperactivity Disorder (ADHD) symptoms, reduced cardiovascular symptoms and reduced mortality for respiratory disorders, reduced health complaints, overall mortality, longevity, birth weight and gestational age in low socioeconomic population, post-disaster recovery, and reduced cortisol.” ... The evidence for positive impacts of urban parks on physical activity was highlighted as “strong,” with the academically established evidence in support of other effects found to be at least “moderate.” (Cecil Konijnendijk et al; The International Federation of Parks and Recreation Administration, 2013)
Land-use decisions affect local and regional climate patterns by the Urban Cool Island Effect. (Rahul Kumar, Vimal Mishra; Indian Institute of Technology Gandhinagar; Buzan, Jonathan; Huber, Matthew; Purdue University; Kumar, Rohini; UFZ-Helmholtz Centre for Environmental Research; Shindell, Drew; Duke University, 2017)
"For every dollar invested in planting [trees], cities see an average $2.25 return on their investment each year." That's estimated at a median value of $967,000 per square kilometer of tree cover, for the 10 megacities surveyed. (David Nowak, ScottMaco; U.S. Department of Agriculture, Forest Service, 2018)
Proximity to green space is a significant monetary value for both retail and residential uses, with increases of up to one-fifth the value of the property. (S. Nicholls, J.L. Crompton, National Recreation and Parks Association; Journal of Leisure Research, 2005)
Of 5 U.S. cities surveyed, every dollar invested in planting trees produced an average $2.25 return on investment each year. (U.S. Department of Agriculture, Forest Service, 2018)
Street trees contribute to wellness, and have about $90k of direct benefit for each tree, over its lifespan, making the return on investment of a tree about 150x. (Dan Burden, 2006)
Reducing Costs of Illnesses: Obesity and Overweight
Almost 30% of people globally are obese, expected to top 50% by 2050. The healthcare cost to treat obesity globally is expected to top $1.2 trillion annually by 2050, 46% of which will fall on the U.S. In 2014, the U.S. spent $324 billion to treat illnesses related to being overweight. (Simon Hay et al; The Lancet, Volume 390, Issue 10100, 1260 - 1344, 2017)
Form-Based Code Individual Case Studies
Once suburban land use is removed, the Route 66 urban corridor is expected to deliver up to $15 million more in taxes per year. (Joe Minnicozzi with PlaceMakers, DPZ, Gridics, and CNT for the City of Albuquerque, 2018)
The maximum density available under the Arlington County's form-based code for Crystal City is one of the deciding factors that drew Amazon to commit their headquarters there. (Arlington County, Virginia, 2018)
New code enabled 2.5 million sf of commercial and residential development; 19,000 population; 55 acres (City of Birmingham, Michigan, 2015)
Since the code was adopted in February, 2003 nearly $500 million in Form Based Code designed projects have either been approved, are in the approval process or will going through soon. The projects are mixed-use and range in size from 16 townhouses to a 269 unit condominium with 40,000 square feet of retail space and close to 500 underground parking spaces. (Arlington County, Virginia, 2017)
New code enabled 36-square block area governed by the Columbia SmartCode; developer purchased land from the State Department of Mental Health for $15 million. (City of Columbia, South Carolina, 2008)
The county-wide comp plan's preferred scenario is enabled by right under the county-wide hybrid form-based and use-based code, and is estimated to save $4 million a year in cost of utilities, roads, school transportation, and maintenance assumes a consolidated water/wastewater utility (Smart Growth America and RCLCO for PlaceMakers, DPZ, CNT, and Doña Ana County, 2017)
New code enabled Project 1: High-end multi-family residential project houses 42 units; structured parking; Project 2: Conversion of 120,000 square feet of office space within a former mill to 120 units of residential housing in three phases. (Dover, New Hampshire, 2019)
New code enabled $50 million in new development entitled within 3 years of SmartCode adoption (during recession), including Aldea de El Paso (2008); El Paso International Airport (2009, 3,000 acre redevelopment of airport and adjacent industrial complex); Medical Center of the Americas (2010, neighborhood anchored by medical complex; 140 acres); Miner Village (2007, brownfield). (City of El Paso, Texas, 2007)
If all of the development projected to occur in Fitchburg over the next 10 years were to be done under the Fitchburg SmartCode District, there would a reduction of approximately 25,102 metric tons of CO2 every year, 25% less than existing development patterns. This is thanks to a collective savings of 57.6 million miles per year through internal trip capture. This is equivalent of taking 4,800 cars off the road over the next 10 years. People would be able to walk and bike to 25% more of their daily needs. (PlaceMakers and Hall Planning & Engineering for City of Fitchburg, 2010)
This paper adds to the literature on sprawl by detailing the effects of zoning and contrasting those effects with an alternative model, the form-based code. (John M. Barry, 2009)
Economic analysis projected an increase in tax basis of approx $1 billion due to the SmartCode over previous zoning; 2,300 acres (City of Leander and Capital Metro, 2004)
New code enabled $100 million in new development built w/in 5 years of SmartCode adoption (during recession), including Hampstead (2009, greenfield). After recession, also enabled Trenholm Court (2016, infill). (City of Montgomery, Alabama, 2016)
Nashville is the first city with over $1 billion of new construction under form-based codes; for that new development, the property values grew at 3.5 time that of the region from 2005 to 2013, and returned up to 1,150x more income per acre to the city than suburban patterns. See also Building Better Budgets, 2013. (Richard Bernhardt; City of Nashville, Tennessee, 2013)
$100 million in new infill development entitled w/in 3 years of SmartCode adoption (pre-recession; but no appreciable other local development for last 20 years.) (City of Petaluma, California, 2006)
New code enabled almost 1,000 acres of greenfield entitled with SmartCode adoption, plus Old Town rezoning. (City of Ranson, West Virginia, 2012)
Alternative planing techniques, including form-based code and performance-based zoning, are put forward as methodologies better suited to environmental goals. (Matti Lemmens, 2009)
First, this research explores policy strategies that can be used to mitigate the negative effects of sprawling development. Second, this research assesses the current policy framework with regard to mitigating the negative effects of sprawling in San Marcos, TX. Third, the results of the assessment are used to make policy recommendations to mitigate the effects of sprawl in San Marcos, TX. (Cameron Freberg; applied research project, Dept. of Political Science, Texas State University, in Partial Fulfillment for the Degree of Masters of Public Administration, Spring 2011, 2011)
Urban developments under the city center form-based code deliver up to 4x the ROI to the government as suburban counterparts. (Joe Minnicozzi for Sarasota County, Florida, 2008)
New code enabled Mizner Park in West Palm Beach, FL: property's assessed value increased by over $40 million in 12 years (City of West Palm Beach, Florida, 2019)
FBC returning 39x more revenue / acre to the City than the Super WalMart, and 4x more jobs / acre (PlaceMakers, LLC for City of Woodstock, Georgia, 2012)
This paper uses a localized analysis of the relationship between zoning and sprawl to answer two main questions: how does zoning contribute to sprawl, and how do form-based codes attempt to mitigate it? (Emily Talen; Journal of Urban Design, 18:2, 175-200, 2013)
PEOPLE
Building Connections: Social Capital
People living in walkable neighborhoods trust neighbors more, participate in community projects and volunteer more than in non-walkable areas. (Shannon Rogers, John Halstead, Kevin Gardner, Cynthia Carlson; University of New Hampshire, 2010)
Building Health: Cycling and Walking
People who cycle to work were 40% less likely to die during the follow-up period. (L Andersen et al; Archives of Internal Medicine, 160, 1621-28, 2000)
The medical costs to treat obesity in the US for 2008 is estimated at $147 billion. (Center for Disease Control; RTI, 2009)
Residential density alone, independent of other factors, was associated with reductions in body fat and obesity. The effect was seen beginning at 1800 residential units per square kilometer (roughly seven units per acre) and was more pronounced beginning at 3200 units per square kilometer (about 13 units per acre). (Below the threshold of 1800 units per square kilometer, increasing density was not helpful.) (Chinmoy Sarkar, PhD (U. of Hong Kong), et al.; The Lancet, 2017)
Communities that invest in bicycling and walking have higher property values, create new jobs, and attract tourists. More jobs are created per dollar spent on pedestrian and cycling amenities than on car-only investments. States with higher rates of bicycling and walking to work also have a higher percentage of the population meeting recommended levels of physical activity, and have lower rates of obesity, high blood pressure, and diabetes. Cycling and walking investments return up to $11.80 for every $1 invested. (The Alliance for Biking & Walking, 2016)
Cycling to school decreases kids' chance of being overweight or obese. (AG Ostergaard et al; Journal of Physical Activity and Health, Volume 9, 2012)
Regular walking increases memory (hippocampus size) and decreases risk of dementia. Exercise training increased hippocampal volume by 2%, effectively reversing age-related loss in volume by 1 to 2 years. (Kirk Erickson et al; University of Pittsburgh, 2011)
Among the more than 72,000 women in the Nurses’ Health Study, those who walked 3 or more hours/week reduced their risk of a coronary event by 35% compared with women who did not walk. Risks of death from breast and uterine cancer were reduced 19% in those who walked 1 to 3 hours per week, by 54% for walking 3 to 5 hours per week. (Harvard University, 2012)
Women who cycle for transportation were 35% less likely to die during the follow-up period. (CE Matthews, AL Jurj, XO Shu, HL Li, G Yang, Q Li, YT Gao, W Zheng; American Journal of Epidemiology, 165, 1343-50, 2007)
In the largest-ever study (429,000 subjects in the UK) of the relationship between neighborhood walkability and blood pressure, researchers found that neighborhood walkability, based on a composite index of metrics such as residential and commercial density, the availability of public transit, amount of pedestrian activity, and proximity to attractive destinations, was associated with lower systolic blood pressure, lower diastolic blood pressure, and lower incidence of hypertension. (Chinmoy Sarkar, PhD (U. of Hong Kong), et al.; International Journal of Hygiene and Environmental Health, 2018)
Regular cycling is correlated to a 50% less heart disease, observing people who cycle 20 miles a week compared to those who do not exercise at all. (Purdue University, 2017)
Combining vigorous exercise and walking each week produced a 50% reduced mortality. (Peter Kokkinos, 2012)
The average white male living in a compact community weighs 10 pounds less than his counterpart in a low density subdivision. (Lawrence Frank; British Columbia School of Planning, 2007)
Commuters are more satisfied with cycling than driving or taking transit, even in Canadian winter. (D. Willis, K Manaugh, A El-Geneidy, 2013)
Every 1% rise in the urban sprawl index increases the risk of obesity by 0.5%. (Russ Lopez; Boston University School of Public Health, 2003)
Researchers used driver’s license data to collect height, weight, and residential addresses of 453,927 adults living in Salt Lake County and correlated those data with walkability characteristics of the subjects’ home neighborhoods. “Based upon the analysis, a man of average height and weight who lived in the most walkable neighborhood in Salt Lake County would be expected to weigh an average of 10 pounds less than a man living in the least walkable neighborhood. For women, the difference would be 6 pounds.” ... “Approximately doubling the proportion of neighborhood residents walking to work decreases an individual's risk of obesity by almost 10%. Adding a decade to the average age of neighborhood housing decreases women's risk of obesity by about 8% and men's by 13%. Population density is unrelated to weight in four of six models, and inconsistently related to weight measures in two models. Pedestrian-friendly street networks are unrelated to BMI but related to lower risks of overweight and obesity in three of four models.” (Ken R. Smith, PhD (U. of Utah) et al.; American Journal of Preventive Medicine, 2008)
While the number of overweight kids is starting to plateau in developed countries, the number worldwide have increased by a factor of 10 in the last 40 years. 124 million boys and girls are obese. (Leandra Abarca-Gómez et al; World Health Organization; The Imperial College in London, 2017)
Building Health: Loneliness
14% of the UK, or about 9 million people, often or always feel lonely. This costs the country billions annually. So in early 2018, U.K. Minister of Loneliness, Tracey Crouch, was appointed. (Jo Cox Commission on Loneliness, 2018)
Building Health: Nature
“CARP’s social isolation and loneliness survey was completed by 5,308 CARP members from every province and territory, except Nunavut. This poll was conducted by e-mail from April 17, 2017 to March 1th, 2017. 99.4% of respondents were over 55. The combined effects of living near a park and going to parks frequently were about as good at reducing loneliness as being married.” For purposes of comparison, the effects of living near and frequently visiting a library were also found quite beneficial in reducing loneliness, “but not quite as substantial as the benefits of living near parks.” The same was true of living near “high quality” public transit. The findings were unaffected by socio-economic status. (Canadian Association of Retired Persons, 2017)
Cleanup and greening of vacant lots in lower-income neighborhoods produced mental health benefits. “This citywide cluster randomized trial examined 442 community-dwelling sampled adults living in Philadelphia, Pennsylvania, within 110 vacant lot clusters randomly assigned to 3 study groups. Participants were followed up for 18 months preintervention and postintervention ... The greening intervention involved removing trash, grading the land, planting new grass and a small number of trees, installing a low wooden perimeter fence, and performing regular monthly maintenance. The trash cleanup intervention involved removal of trash, limited grass mowing where possible, and regular monthly maintenance. The control group received no intervention.” ... “Among 342 participants included in the analysis, feeling depressed significantly decreased by 41.5% and self-reported poor mental health showed a reduction of 62.8% for those living near greened vacant lots compared with control participants. The remediation of vacant and dilapidated physical environments, particularly in resource-limited urban settings, can be an important tool for communities to address mental health problems, alongside other patient-level treatments.” (Eugenia C. South, M.D., M.S., et al.; Journal of the American Medical Association Network Open , 2018)
Women living in homes surrounded by higher levels of greenery within a 250-meter radius had a 12% lower mortality rate. (Peter James; Jaime Hart, Rachel Banay, Francine Laden; Environ Health Perspect 124:1344–1352, 2016)
The benefits of nature are dose-dependent: people who make long visits (30 minutes or more) to green spaces have lower rates of depression and high blood pressure, and engage in more physical activity, than those who make only short visits; people who visit more frequently exhibit greater social cohesion and engage in more physical activity than those who visit less. “A dose-response analysis for depression and high blood pressure suggest that visits to outdoor green spaces of 30 minutes or more during the course of a week could reduce the population prevalence of these illnesses by up to 7% and 9% respectively. Given that the societal costs of depression alone in Australia are estimated at AUD$12.6 billion per annum, savings to public health budgets across all health outcomes could be immense.” (Danielle F. Shanahan (U. of Queensland AUS), et al.; Nature: Scientific Reports , 2016)
“This study investigated 101 public high schools in southeastern Michigan to examine the role played by the availability of nearby natural environments in the academic achievement and behavior of high school students. All analyses controlled for student socio-economic status, racial/ethnic makeup, building age, and size of enrollment.” ... “The results reveal that nature exposure beneficially affects student performance. Specifically, views with greater quantities of natural features (e.g., trees, shrubs) from classroom as well as cafeteria windows were associated with higher standardized test scores, graduation rates, and percentages of students planning to attend college, and lower occurrences of criminal behavior.” ... “In addition, the results suggest that the trees and shrubs viewed from the lunch sites and classroom windows need to be close to the viewer to be of greater benefit. Finally, large expanses of landscape lacking in natural features had a negative influence on test scores, intentions to attend college, and college plans. Such landscapes included large areas of lawn, parking lots, and bordering farmlands.” (Rodney H. Matsuoka (doctoral dissertation, U. of Michigan), 2008)
In a British study of 1064 individuals who relocated during the study period, people who move from a less green neighborhood to a greener one experienced an immediate improvement in mental health that was sustained for at least 3 years after they moved. The findings held up even after the authors adjusted their data to remove effects from other factors likely to affect mental health over time – such as income, employment and education – along with factors related to personality. (Ian Alcock, et al; Environmental Science & Technology , 2013)
U.S. life expectancy is in decline for the first time since 1993. 3 of top 4 culprits: heart disease, diabetes, and Alzheimer’s, and all of which, as the other studies listed here show, are impacted by the forms of our built environment, and how well we integrate nature into cities. (Jiaquan Xu, Sherry Murphy, Kenneth Kochanek, Elizabeth Arias; U.S. National Center for Health Statistics; NCHS Data Brief No. 267, 2016)
More than 50% of people now live in urban areas. By 2050 this proportion will be 70%. Participants who went on a 90-min walk through a natural environment reported lower levels of rumination and showed reduced neural activity in an area of the brain linked to risk for mental illness compared with those who walked through an urban environment. These results suggest that accessible natural areas may be vital for mental health in our rapidly urbanizing world. (Gregory Bratmana, Paul Hamiltonb, Kevin Hahnc, Gretchen Daily, James Grossc; PNAS 2015 112 (28) 8567-8572, 2015)
Neighborhood tree density is positively associated with significantly higher health perception and better heart health. The study focused on a large urban population center (Toronto, Canada) and combined high-resolution satellite imagery and individual tree data from Toronto with questionnaire-based self-reports of general health perception, cardio-metabolic conditions and mental illnesses from the Ontario Health Study. “We find that having 10 more trees in a city block, on average, improves health perception in ways comparable to an increase in annual personal income of $10,000 and moving to a neighborhood with $10,000 higher median income or being 7 years younger. We also find that having 11 more trees in a city block, on average, decreases cardio- metabolic conditions in ways comparable to an increase in annual personal income of $20,000 and moving to a neighborhood with $20,000 higher median income or being 1.4 years younger.” (Omid Kardan (U. of Chicago), et al.; Nature: Scientific Reports, 2015)
“Green space can provide mental health benefits and possibly lower risk of psychiatric disorders. This nation-wide study covering >900,000 people [in Denmark] shows that children who grew up with the lowest levels of green space had up to 55% higher risk of developing a psychiatric disorder independent from effects of other known risk factors. Stronger association between cumulated green space and risk during childhood constitutes evidence that prolonged presence of green space is important. Our findings affirm that integrating natural environments into urban planning is a promising approach to improve mental health and reduce the rising global burden of psychiatric disorders.” (Kristine Engemann (Aarhus U., Denmark), et al.; Proceedings of the National Academy of Sciences (U.S.) , 2019)
Participants (135 individuals aged 60 years and older, some healthy and some with chronic lung or heart disease) completed a 2 hour walk either along a commercial street in London (Oxford Street) or in an urban park (Hyde Park). Researchers measured heart and lung functions both before and after the exercise. The subjects who walked in the park, whether healthy or with chronic maladies, showed significant improvement in pulmonary and cardiovascular function; those who walked along Oxford Street showed negative effects in those indicators. “Our findings suggest that healthy people, as well as those with chronic cardiorespiratory disorders, should minimize walking on streets with high levels of pollution because this curtails or even reverses the cardiorespiratory benefits of exercise. Instead, walking exercise should be enjoyed in urban green space areas away from high density traffic.” (Rudy Sinharay, MBBS (National Heart and Lung Institute and MRC-PHE Centre for Environment and Health, Imperial College, London, UK); The Lancet, 2018)
This somewhat brief report is very good but, frustratingly, is not annotated and has only a cursory bibliography that fails to include the key study. Nonetheless: “Scientists in the Netherlands examined the prevalence of anxiety disorders in more than 345,000 residents and found that people who lived in residential areas with the least green spaces had a 44 percent higher rate of physician-diagnosed anxiety disorders than people who lived in the greenest residential areas. The effect was strongest among those most likely to spend their time near home, including children and those with low levels of education and income. Time spent in the lushness of green environments also reduces sadness and depression. In the Dutch study, the prevalence of physician-diagnosed depression was 33 percent higher in the residential areas with the fewest green spaces, compared to the neighborhoods with the most.” (National Recreation and Park Association, 2010)
Epigenetics intones that even though you’re dealt your hand of DNA, your behavior has the ability to turn the sound up or down on your genetic predispositions. This study goes as far as to say your zip code is a more accurate health forecast than your genetic code. (Project for Public Spaces, 2016)
“Even after controlling for confounders, lower quantity of neighbourhood greenspace was related to poorer spatial working memory. Importantly, neighbourhood deprivation did not modify this relationship. Therefore, lower quantity of greenspace was related to poorer spatial working memory similarly in deprived and non-deprived neighbourhoods. Children living in greener urban neighbourhoods have better spatial working memory.” The sample was 4,758 11-year-olds living in urban areas in England. (Eirini Flouri (University College London), et al.; British Journal of Educational Psychology, 2018)
Researchers examined a database of “approximately 1,256,000 individuals,” a nationally representative sample from the Canadian Census representing residents of Canada’s 30 largest metro areas. Census information was compared to tax return data (to control for socioeconomic factors), the Canadian mortality database, and neighborhood greenness measured by the Normalized Difference Vegetation Index (NDVI). Examining a decade’s worth of data, the authors found “decreased risks of mortality in the range of 8–12 percent from all causes of death examined with increased greenness around participants’ residence,” when neighborhood greenness was measured within 250 meters and 500 meters of the residence. The greatest beneficial effects of a greener neighborhood were found for respiratory diseases. The researchers noted that “controlling for exposures to ambient nitrogen dioxide strengthened the associations substantially.” (Dan L. Crouse, PhD (U. of New Brunswick), et al.; The Lancet Planetary Health, 2017)
You don’t have to be touching nature to be healed by it. Just looking out a window at a garden is proven to increase your recovery rate. This psychological and physical boost is a micro-restorative experience. (Roger Ulrich; Science, 1984)
Building Health: Nature and Urban Form
Social determinants of health include quality education, stable employment, safe homes and neighborhoods, and access to preventive services. Poor health outcomes are often made worse by the interaction between individuals and their social and physical environment. The targets for weight loss set in this framework of the U.S. Department of Health and Human Services are not currently being met by the population. (Office of Disease Prevention and Health Promotion, 2017)
Building Health: Urban Form
Inadequate levels of physical activity are associated with $117 billion in annual health care costs in the U.S. alone. (Division of Nutrition, Physical Activity, and Obesity, National Center for Chronic Disease Prevention and Health Promotion, 2018)
Important new study in British Medical Journal tracked 263,000 commuters for 5 years & found that folks who ride a bike to work have a 41% lower chance of dying overall vs people who drive/take transit (Carlos A Celis-Morales et al.; BMJ 2017;357:j1456, 2017)
Social equity is a generator of social capital. Which in turn builds more equity. Every ten minutes of commuting reduces all forms of social capital by 10%. (Robert Putnam, 2000)
A person with a one-hour drive to work must earn 40% more to be as satisfied as someone who walks. Shifting from a long commute to a short walk would make a single person as happy as if s/he had found a new love. (ARUP, 2017)
Living in neighbourhoods with higher levels of aesthetics and more water and green space was associated with being very happy. Individuals who perceived their neighbourhood to be safer, more functional and cleaner, with a larger social network, more social cohesion and who trusted their neighbours, were more likely to be very happy. In contrast, living in neighbourhoods with objectively assessed higher safety, functionality, and more destinations was associated with being less happy. Except for some evidence for interaction by employment status, educational level, gender and European region, the associations between environmental characteristics and happiness had similar directions and sizes across socio-economic and socio-demographic subgroups. (European Journal of Public Health, Volume 27, Issue suppl_3, 2017)
In the U.S., the number of people struck and killed by cars while walking or bicycling has reached an all time high. Many of these deaths occur on streets with fast-moving cars and poor pedestrian infrastructure. People walk along these roads despite the clear safety risks. Pedestrian deaths up 35% in U.S. in decade, as drivers killed 49,340 people who were walking on streets between 2008 and 2017. (Smart Growth America and the National Complete Streets Coalition, 2019)
13 people die every day in the U.S. because of fatal street design. From 2008 to 2017: Pedestrian deaths increased by 35.4% Vehicle miles traveled increased by 8.1% Walking as a share of all trips increased by less than 1% Traffic deaths among motor vehicle occupants decreased by 6.1%. (Smart Growth America and the National Complete Streets Coalition, 2019)
Seniors are more likely to "walk for transport" in neighborhoods with moderate density and street connectivity. (Fatima Ghania, Jerome Racheleb, Loha, HY Venurs, Simon Washingtonc, Gavin Turrella; Journal of Transport & Health, 2018)
Across Utah, a less than active person annually spends $3 less on healthcare for every additional mile walked and $0.75 for every additional mile biked. (Utah Transit Authority; Urban Design 4 Health, Inc.; Fehr and Peers; HDR Engineers, 2017)
U.S. metros with the highest levels of walkable urbanism are also the most educated and wealthy (as measured by GDP per capita)— and, surprisingly, the most socially equitable. There are substantial and growing rental rate premiums for walkable urban office (90 percent), retail (71 percent), and rental multi-family (66 percent) over drivable sub-urban products. Combined, these three product types have a 74 percent rental premium over drivable sub-urban. The national concern about social equity has been exacerbated by the very rent premiums highlighted above, referred to as gentrification. Counter-intuitively, measurement of moderate-income household (80 percent of AMI) spending on housing and transportation, as well as access to employment, shows that the most walkable urban metros are also the most socially equitable. The reason for this is that low cost transportation costs and better access to employment offset the higher costs of housing. This finding underscores the need for continued, and aggressive, development of attainable housing solutions. (Smart Growth America, 2016)
With all neighbourhoods, urban and rural, taken together, the biggest difference between the happiest and least happy is the extent to which people feel a sense of belonging in their communities. The happier communities have, on average, lower commute times, and fewer people who spend more than 30 per cent of their income on housing. On average, people living in cities have significantly lower life satisfaction than rural dwellers, despite their higher levels of income, employment and education. (John Helliwell et al; Vancouver School of Economics, 2018)
An increase from 20 to 40 annual transit trips per person could reduce traffic fatalities by anywhere from 10 to 40%. (American Public Transportation Association and the Vision Zero Network, 2018)
In under a decade, over 112,000 people were killed in speeding-related crashes in the U.S. For all causes of traffic fatalities, in 2016 alone over 37,000 people died in car crashes in the U.S. This is despite the effectiveness of engineering countermeasures for speeding is well established, including roundabouts and road diets. Information about them is available in several sources, including the AASHTO Highway Safety Manual (AASHTO 2010) and the FHWA’s online Crash Modification Factors Clearinghouse. Engineering countermeasures for speeding are also promoted in the National Association of City Transportation Planners’ Urban Street Design Guide (NACTO 2017) and are increasingly being adopted by state and local transportation departments. (National Transportation Safety Board; NTSB/SS-17/01 PB2017-102341, 2017)
Physical activity has many benefits, including reducing the risk of developing chronic diseases and supporting healthy aging. Walking is the most common form of physical activity across the country and an excellent way to help people become more active. In September 2015, the Office of the Surgeon General of the US Department of Health and Human Services released Step It Up! The Surgeon General’s Call to Action to Promote Walking and Walkable Communities to increase walking among people across the United States. Despite these benefits and the call to action, 49.9% of all US adults and 27.1% of high school students meet the recommendation for aerobic physical activity. (Centers for Disease Control and Prevention; US Dept of Health and Human Services, 2017)
Report encourages Canadians to pay attention to how urban form impacts health. Most Canadian development bylaws do not enable the sort of urban form outlined as a key determinant of health in this report, namely mixed use, walkable places. (Dr. Theresa Tam, Chief Public Health Officer of Canada, 2017)
Part I of this report will focus on how present literature and research shows the link between the design of the built environment and the physical health of the people who inhabit them, and will review those findings in how they address the relationships between obesity, urban sprawl, and urban form. Part II will explore the current conditions of land regulation, specifically zoning, focusing on their weaknesses in prioritizing health. (Allison Bustin, 2015)
Building Supply: Market Preference
Fewer young people want cars. In 1995, people age 21 to 30 drove 21% of all miles driven in the U.S.; in 2009 it was 14%, despite consistent growth of the age group. Living car-free in walkable areas fits younger lifestyles, as does owning less stuff, enabled by the sharing economy. (Advertising Age, 2010)
For the first time since NAR started its survey in 2007, most people (53%) prefer smaller homes in neighborhoods with easy walks to shops and restaurants. (National Association of Realtors, 2017)
The number of people of all ages who have driver’s license decreased between 2011 and 2014 in the U.S. The group from 16 to 44 years old has been on the wane since 1983. The number is especially big for teens: in 1983, 46% of 16-year-olds had licenses, but in 2014 only 24% did. (Michael Sivak, Brandon Schoettle; Transportation Research Institute; The University of Michigan, 2016)
Seniors want walkability, safety, proximity to family. (A Place for Mom, 2017)
Gen Z (or iGen) in the U.S. are less likely to want to drive. (JM Twenge, H Park; San Diego State University and Bryn Mawr College; Child Development, 2017)
Australian survey: "Young people want walkable neighbourhoods, but safety is a worry. Only 15% of young woman felt safe walking at night, compared to 54% of the men.” (Dr. Jan Garrard, Active Transport Consultant, for Victoria Walks and Youth Affairs Council Victoria, 2017)
PLANET
Decreasing Emissions: Cycling, Walking, and Transit
One pound CO2 saved for every mile pedaled on a bike-share bike. (Susan Shaheen, 2014)
Planet
Decreasing Emissions: Land Development Patterns
41 million acres of rural land the US lost to development from 1982 to 2007. That’s almost the size of the State of Washington. We are developing real lands at a rate of 40 acres per hour. (American Farmland Trust, 2017)
Quantitative meta-regression analysis of published literature shows a halving of the distance between a particular development and downtown is likely to reduce per capita driving associated with that development by as much as 32 percent. In addition, for every doubling of local density, expect a 22 percent drop in vehicle miles traveled per capita. For every doubling of street connectivity (as measured by, say, intersections per square mile), expect a 14 percent decrease in driving. This is an odd study, in that the author’s conclusions don’t match his data. His conclusions: “I find that compact development does make people drive less, because most of the compact development features I study have a statistically significant negative influence on driving. The impact, however, is fairly small: Compact development features do not appear to have much influence on driving.” Maybe this was because he defined “compact development” as something separate from location (although he measured location as one of the key components, and doesn’t say that explicitly), which he found to be the most significant influence on VMT. (Professor Mark Stevens (U. of British Columbia); Journal of the American Planning Association, 2017)
Land development patterns and vehicle miles traveled (VMT) have a significant impact on petroleum use and greenhouse gas (GHG) emissions. Doubling residential density while increasing nearby employment, transit, and mixed use can decrease VMT by 25%, along with reductions in energy consumption and GHGs. (The Transportation Research Board; National Academy of Sciences, Engineering, and Medicine, 2010)
“This new book documents how key changes in land development patterns could help reduce vehicle greenhouse gas emissions. Based on a comprehensive review of dozens of studies by leading urban planning researchers, the book concludes that urban development is both a key contributor to climate change and an essential factor in combating it. The authors make the case that one of the best ways to reduce vehicle travel is compact development: building places in which people can get from one place to another without driving. This includes developments with a mix of uses and pedestrian-friendly designs. Changing demographics, shrinking households, rising gas prices, and lengthening commutes are contributing to the demand for smaller homes and lots, townhouses, and condominiums near jobs and other activities. Current government policies and regulations encourage sprawling, auto-dependent development. The book recommends changes that can be made to make green neighborhoods more available and more affordable.” (Reid Ewing, Keith Bartholomew, Steve Winkelman, Jerry Walters, Don Chen; Urban Land Institute, Smart Growth America, Center for Clean Air Policy, National Center for Smart Growth Research & Education, University of Utah, 2008)
Households in drivable suburban neighborhoods spend on average 24% of their income on transportation; those in walkable neighborhoods spend about 12%. The difference amounts to $700 billion a year in total, according to Scott Bernstein of the Center for Neighborhood Technology. (Scott Bernstein; Center for Neighborhood Technology, 2015)
New Yorkers’ emit far less carbon (5.8 metric tons of CO2 per capita in 2014) than those of residents of comparable U.S. cities and about a third as much carbon as the activities of the average American (16.5 metric tons of CO2 per capita in 2014). (New York City, 2016)
A comparison based on national averages indicates that the energy consumption (and, thus, global warming emissions) of a typical household in a transit-oriented location is likely to be less than that of a household in a conventional suburban location, even if the suburban household employs energy-efficient building technology and drives fuel-efficient vehicles. (Jonathan Rose Companies; U.S. Environmental Protection Agency, 2011)
Urban climate policies can generate up to 14 million urban jobs & prevent 1.3 million premature deaths annually by 2030. (Global Covenant of Mayors for Climate and Energy; New Climate Institute; C40 Cities, 2018)
A thoroughly documented and annotated encyclopedia of academic and other authoritative evidence on a wide range of topics, with 538 endnotes and its own 19-page bibliography. “Where we locate development has significant impacts on environmental resources. Three mitigation strategies are key: safeguarding sensitive areas; infill development in built-up areas; and focusing development around existing transit stations.” ... "How we build also influences development’s impact on the environment and human health.” Key mitigation strategies include compact development, mixed-use development, street connectivity, community design, destination accessibility, transit accessibility, and green building. (Melissa G. Kramer, Ph. D., et al.; U.S. Environmental Protection Agency, EPA 231K13001, 2013)
Walkable communities can quell the effects of global warming and peaking oil with mixed use, compact urban design. An average family in auto-dependent community drives 24,000 miles per year, while a family in a walkable community of 16 dwelling units per acre and compact mixed use drives 9,000 miles per year. (Doug Farr; Sustainable Urbanism, 2007)
A painstaking ‘meta-analysis’ of nearly 50 published studies on the subject of land use and travel behavior finds location matters most when it comes to land use, driving and the environment. The study's key conclusion is that destination accessibility is by far the most important land use factor in determining a household or person’s amount of driving. "Destination accessibility" is a technical term that describes a given location’s distance from common trip destinations (and origins). It almost always favors central locations within a region; the closer a house, neighborhood or office is to downtown, the better its accessibility and the lower its rate of driving. The authors found that such locations can be almost as significant in reducing driving rates as other significant factors (e.g., neighborhood density, mixed land use, street design) combined. “Next most strongly associated with VMT are the design metrics intersection density and street connectivity. This is surprising, given the emphasis in the qualitative literature on density and diversity, and the relatively limited attention paid to design . . . Both short blocks and many interconnections apparently shorten travel distances to about the same extent.” Beyond VMT, the rate of walking “is most strongly related to measures of land use diversity, intersection density, and the number of destinations within walking distance.” (Professors Reid Ewing (U. of Utah) and Robert Cervero (UC-Berkeley); Journal of the American Planning Association, 2010)
Decreasing Emissions: Trees
"Urban trees remove enough particulate matter from the air to create up to $60 million worth of reductions in healthcare needs at the city level." (The Nature Conservancy, 2017)
Increasing Water Quality: Compact Development
“For a constant or given population, then, higher density can result in dramatically lower total loadings than more diffuse suburban densities. The model showed that a simple doubling of standard suburban densities [to 8 dwelling units per acre (DUA) from about 3 to 5 DUA] in most cases could do more to reduce contaminant loadings associated with urban growth than many traditional stormwater best management practices (BMPs), and that higher densities such as those associated with transit-oriented development could outperform almost all traditional BMPs, in terms of reduced loadings per a constant population. Because higher density is associated with vibrant urban life, building a better city may be the best BMP to mitigate the water quality damage that will accompany the massive urban growth expected for the next several decades.” (John S. Jacob and Ricardo Lopez; Journal of the American Water Resources Association, Vol. 45, No. 3, 2009)
“EPA modeled scenarios of different densities at three scales and at three different time-series build-out examples to examine whether lower-density development is always better for water quality. EPA examined stormwater runoff from different development densities at the one-acre, lot, and watershed levels to determine the differences among scenarios. This analysis demonstrated: 1.) Higher-density scenarios generate less stormwater runoff per house at all scales and at all time-series build-out examples. 2.) For the same amount of development, higher-density development produces less runoff and less impervious cover than low-density development. 3.) For a given amount of growth, lower-density development affects more of the watershed.” (Lynn Richards; U.S. Environmental Protection Agency (EPA 231-R-06-001), 2006)
"The goal of this document is to help communities that have adopted smart growth policies and plans recognize the water benefits of those smart growth techniques and suggest ways to integrate those policies into stormwater planning and compliance. Taking credit for the work a community is already doing can be a low-cost and practical approach to meeting water quality goals and regulatory commitments." (Lisa Nisenson; U.S. Environmental Protection Agency (EPA 231-B-05-002), 2005)
WORKS CITED
A Place for Mom. (2017) Senior Living Preferences Survey. https://www.aplaceformom.com/blog/wp-content/static/slps2017/2017-Senior-Living-Preferences-Survey-Report.pdf
Advertising Age. (2010) Is Digital Revolution Driving Decline in U.S. Car Culture?. http://adage.com/article/digital/digital-revolution-driving-decline-u-s-car-culture/144155/
AG Ostergaard et al; Journal of Physical Activity and Health, Volume 9. (2012) Cycle to school is associated with lower BMI and lower odds of being overweight or obese in a large population-based study of Danish adolescents.
https://www.ncbi.nlm.nih.gov/pubmed/22733866
Allison Bustin. (2015) Zoning for Obesity: Incorporating context-based strategies for improved health in municipal zoning codes.
https://smartech.gatech.edu/handle/1853/53781
American Farmland Trust. (2017) American Farmland Trust: Farmland Focus. https://www.farmland.org/our-work/areas-of-focus/farmland
American Planning Association. (2014) Investing in Place for Economic Growth and Competitiveness.
https://www.planning.org/policy/polls/investing/pdf/pollinvestingreport.pdf
American Public Transportation Association and the Vision Zero Network. (2018) Public Transit Is Key Strategy in Advancing Vision Zero, Eliminating Traffic Fatalities. https://www.apta.com/resources/hottopics/Documents/APTA%20VZN%20Transit%20Safety%20Brief%208.2018.pdf
American Public Transportation Association. (2013) The New Real Estate Mantra: Location Near Public Transportation. http://www.apta.com/resources/statistics/Documents/NewRealEstateMantra.pdf
ARUP. (2017) Cities Alive: Towards a walking world. https://www.arup.com/publications/research/section/cities-alive-towards-a-walking-world
Auckland Council's Research and Monitoring Unit. (2018) The Business Case for Walking. http://ourauckland.aucklandcouncil.govt.nz/articles/news/2018/6/traffic-delaying-pedestrian-flow-is-a-cost-too/
Bob Gibbs. (2011) Principles of Urban Retail Planning and Development. http://ca.wiley.com/WileyCDA/WileyTitle/productCd-0470488220.html
Brookings. (2010) The Next Real Estate Boom.
https://www.brookings.edu/articles/the-next-real-estate-boom/
Cameron Freberg; applied research project, Dept. of Political Science, Texas State University, in Partial Fulfillment for the Degree of Masters of Public Administration, Spring 2011. (2011) San Marcos, Texas SmartCode: An Exploration of Policy Options to Mitigate the Negative Effects of Sprawling Development: A Case Study of San Marcos, TX. https://digital.library.txstate.edu/handle/10877/3686
Canadian Association of Retired Persons. (2017) CARP Survey Reveals How to Avoid Loneliness as We Age.
https://www.carp.ca/2017/06/05/loneliness-survey-results/
Carlos A Celis-Morales et al.; BMJ 2017;357:j1456. (2017) Association between active commuting and incident cardiovascular disease, cancer, and mortality: prospective cohort study. https://www.bmj.com/content/357/bmj.j1456
CE Matthews, AL Jurj, XO Shu, HL Li, G Yang, Q Li, YT Gao, W Zheng; American Journal of Epidemiology, 165, 1343-50. (2007) Influence of exercise, walking, cycling, and overall nonexercise physical activity on mortality in Chinese women. https://www.ncbi.nlm.nih.gov/pubmed/17478434
Cecil Konijnendijk et al; The International Federation of Parks and Recreation Administration. (2013) Benefits of urban parks: a systematic review. A report for IPFRA. http://citeseerx.ist.psu.edu/viewdoc/download?doi=10.1.1.395.927&rep=rep1&type=pdf Additional link: https://www.researchgate.net/publication/267330243_Benefits_of_Urban_Parks_A_systematic_review_-_A_Report_for_IFPRA
Center for Disease Control; RTI. (2009) Annual Medical Spending Attributable to Obesity: Payer- and Service-Specific Estimates.
https://www.cdc.gov/media/pressrel/2009/r090727.htm
Center for Neighborhood Technology. (2010) Penny Wise, Pound Fuelish: New Measures of Housing + Transportation Affordability.
https://www.cnt.org/publications/penny-wise-pound-fuelish-new-measures-of-housing-and-transportation-affordability
Centers for Disease CSontrol and Prevention; US Dept of Health and Human Services. (2017) Status Report for Step It Up! The Surgeon General’s Call to Action to Promote Walking and Walkable Communities.
https://www.cdc.gov/physicalactivity/walking/call-to-action/pdf/status-report.pdf
Chinmoy Sarkar, PhD (U. of Hong Kong), et al.; International Journal of Hygiene and Environmental Health. (2018) Neighbourhood walkability and incidence of hypertension: Findings from the study of 429,334 UK Biobank participants. https://www.ncbi.nlm.nih.gov/pubmed/29398408
Chinmoy Sarkar, PhD (U. of Hong Kong), et al.; The Lancet. (2017) Association between adiposity outcomes and residential density: a full-data, cross-sectional analysis of 419 562 UK Biobank adult participants.
https://www.thelancet.com/journals/lanplh/article/PIIS2542-5196(17)30119-5/fulltext
Chris Leinberger, Mariela Alfonzo; Brookings Institute. (2012) Walk this Way. https://www.brookings.edu/wp-content/uploads/2016/06/25-walkable-places-leinberger.pdf
City of Calgary. (2009) PlanIt Calgary. http://www.calgary.ca/Transportation/TP/Pages/Planning/Forecasting/2009-PlanIT-Scenario-Archives.aspx
City of Copenhagen. (2012) Copenhagen's Bike Account.
http://grist.org/list/one-mile-on-a-bike-is-a-42-economic-gain-to-society-one-mile-driving-is-a-20-loss/
City of Leander and Capital Metro. (2004) Leander, Texas SmartCode. https://www.leandertx.gov/tod/page/history-tod
City of London, Ontario. (2013) Building a Mixed-Use, Compact City. https://www.london.ca/business/Planning-Development/Official-Plan/Documents/RethinkLondon/4%20Building%20a%20MixedUse%20Compact%20City.pdf
D. Willis, K Manaugh, A El-Geneidy. (2013) Uniquely Satisfied: Exploring Cyclists Trip Satisfaction.
http://tram.mcgill.ca/Research/Publications/Cycling_Satisfaction_TRB.pdf
Dan Burden. (2006) Urban Street Trees: 22 Benefits. http://www.walkable.org/download/22_benefits.pdf
Dan L. Crouse, PhD (U. of New Brunswick), et al.; The Lancet Planetary Health. (2017) Urban greenness and mortality in Canada's largest cities: a national cohort study. https://www.thelancet.com/journals/lanplh/article/PIIS2542-5196(17)30118-3/fulltext
Danielle F. Shanahan (U. of Queensland AUS), et al.; Nature: Scientific Reports. (2016) Health Benefits from Nature Experiences Depend on Dose.
https://www.nature.com/articles/srep28551
David Nowak, ScottMaco; U.S. Department of Agriculture, Forest Service. (2018) i-Tree Tools. https://theconversation.com/we-calculated-how-much-money-trees-save-for-your-city-95198
Division of Nutrition, Physical Activity, and Obesity, National Center for Chronic Disease Prevention and Health Promotion. (2018) Active People, Healthy Nation. https://www.cdc.gov/physicalactivity/resources/factsheets.html
Doug Farr; Sustainable Urbanism. (2007) Sustainable Urbanism.
http://farrside.com/book/
Dr. Jan Garrard, Active Transport Consultant, for Victoria Walks and Youth Affairs Council Victoria. (2017) Young People and Walking.
https://t.co/i6QiOnGdw2?amp=1
Dr. David Gordon. (2016) Still Suburban. http://www.canadiansuburbs.ca/files/Still_Suburban_Monograph_2016.pdf
Dr. Theresa Tam, Chief Public Health Officer of Canada. (2017) The Chief Public Health Officer’s Report on the State of Public Health in Canada 2017 – Designing Healthy Living. https://www.canada.ca/en/public-health/services/publications/chief-public-health-officer-reports-state-public-health-canada/2017-designing-healthy-living.html
Eirini Flouri (University College London), et al.; British Journal of Educational Psychology . (2018) The role of neighbourhood greenspace in children’s spatial working memory. https://onlinelibrary.wiley.com/doi/full/10.1111/bjep.12243
Elora Raymond of Clemson University, Jessica Dill of the Federal Reserve Bank of Atlanta, Yongsung Lee of Georgia Institute of Technology; Journal of Planning Education and Research. (2018).
https://journals.sagepub.com/doi/10.1177/0739456X18807751 Additional link: https://www.citylab.com/life/2018/11/millennials-buy-homes-cities-generation-x-suburbs/575755/
Emily Talen; Journal of Urban Design, 18:2, 175-200. (2013) Zoning For and Against Sprawl: The Case for Form-Based Codes. https://www.tandfonline.com/doi/full/10.1080/13574809.2013.772883?scroll=top&needAccess=true
Eugenia C. South, M.D., M.S., et al.; Journal of the American Medical Association Network Open. (2018) Effect of Greening Vacant Land on Mental Health of Community-Dwelling Adults.
https://jamanetwork.com/journals/jamanetworkopen/fullarticle/2688343
European Journal of Public Health, Volume 27, Issue suppl_3. (2017) Contextual correlates of happiness in European adults - the SPOTLIGHT study. https://academic.oup.com/eurpub/article/27/suppl_3/ckx187.451/4556417
Fatima Ghania, Jerome Racheleb, Loha, HY Venurs, Simon Washingtonc, Gavin Turrella; Journal of Transport & Health. (2018) Do differences in built environments explain age differences in transport walking across neighbourhoods? https://www.sciencedirect.com/science/article/pii/S2214140517306874
Forbes. (2012) Pedaling to Prosperity. http://www.forbes.com/sites/tanyamohn/2012/05/20/bicyclists-in-the-united-states-save-at-least-4-6-billion-a-year-by-riding-instead-of-driving-ased-on-friday-to-coincide-with-national-bike-to-work-day-part-of-national-bike-month-which-occurs-each/
Gary Pivo, Jeffrey Fisher; Indiana University, University of Arizona. (2010) The Walkability Premium in Commercial Real Estate Investments. http://www.u.arizona.edu/~gpivo/Walkability%20Paper%208_4%20draft.pdf
Global Commission on the Economy and Climate. (2018) The New Climate Economy. https://newclimateeconomy.report/2018/
Global Covenant of Mayors for Climate and Energy; New Climate Institute; C40 Cities. (2018) Opportunity 2030: More Jobs; Better Health; Liveable Cities. https://www.globalcovenantofmayors.org/wp-content/uploads/2018/09/ClimateOpportunity_Summary_online.pdf
Gregory Bratmana, Paul Hamiltonb, Kevin Hahnc, Gretchen Daily, James Grossc; PNAS 2015 112 (28) 8567-8572. (2015) Nature experience reduces rumination and subgenual prefrontal cortex activation.
http://www.pnas.org/content/112/28/8567.full.pdf
Halifax Regional Municipality, Nova Scotia. (2005) Settlement Pattern and Form with Service Cost Analysis.
http://usa.streetsblog.org/wp-content/uploads/sites/5/2015/03/Halifax-data.pdf
Harvard University. (2012) Harvard University Women’s Health Study. https://www.hsph.harvard.edu/nutritionsource/2016/08/16/nurses-health-study-40-year-anniversary-ajph/
Ian Alcock, et al; Environmental Science & Technology . (2013) Longitudinal Effects on Mental Health of Moving to Greener and Less Green Urban Areas. https://www.researchgate.net/publication/259249806_Longitudinal_Effects_on_Mental_Health_of_Moving_to_Greener_and_Less_Green_Urban_Areas Additional link: https://www.eurekalert.org/pub_releases/2014-01/uoe-gsd010314.php
Jiaquan Xu, Sherry Murphy, Kenneth Kochanek, Elizabeth Arias; U.S. National Center for Health Statistics; NCHS Data Brief No. 267. (2016) Mortality in the United States, 2015. https://www.cdc.gov/nchs/products/databriefs/db267.htm
JM Twenge, H Park; San Diego State University and Bryn Mawr College; Child Development. (2017) The Decline in Adult Activities Among U.S. Adolescents, 1976-2016. http://onlinelibrary.wiley.com/doi/10.1111/cdev.12930/full
Jo Cox Commission on Loneliness. (2018) Loneliness: Start a Conversation. https://www.jocoxloneliness.org/pdf/a_call_to_action.pdf
Joe Cortright, Impresa, Inc.; CEOs for Cities. (2009) Walking the Walk: How Walkability Raises Home Values in U.S. Cities.
http://blog.walkscore.com/wp-content/uploads/2009/08/WalkingTheWalk_CEOsforCities.pdf
Joe Cortright; City Observatory. (2015) Surging City Center Job Growth. http://cityobservatory.org/city-center-jobs/
Joe Minicozzi; Urban3. (2010) Best bet for tax revenue: mixed-use downtown development. https://www.cnu.org/publicsquare/2010/09/13/best-bet-tax-revenue-mixed-use-downtown-development
Joe Minnicozzi for Sarasota County, Florida. (2008) Sarasota, Florida SmartCode. https://preview.mayorsinnovation.org/images/uploads/pdf/MINICOZZIsmall.pdf
John Helliwell et al; Vancouver School of Economics. (2018) How happy are your neighbours? Variation in life satisfaction among 1,200 Canadian neighbourhoods and communities. https://news.ubc.ca/2018/05/24/the-happiest-and-least-happy-places-in-canada/
John M. Barry. (2009) Form-Based Codes: Measured Success Through both Mandatory and Optional Implementation. https://heinonline.org/HOL/LandingPage?handle=hein.journals/conlr41&div=10&id=&page=&t=1559257722
John S. Jacob and Ricardo Lopez; Journal of the American Water Resources Association, Vol. 45, No. 3. (2009) Is Denser Greener? An Evaluation of Higher Density Development as an Urban Stormwater-Quality Best Management Practice. https://onlinelibrary.wiley.com/doi/abs/10.1111/j.1752-1688.2009.00316.x Additional link: https://onlinelibrary.wiley.com/doi/epdf/10.1111/j.1752-1688.2009.00316.x Additional link: https://kaidbenfieldarchive.com/20100601-watershed-benefits-of-smart-growth-duplicate-transporta.html
Jonathan Ford; Morris Beacon. (2010) Smart Growth & Conventional Suburban Development An infrastructure case study completed for the EPA. https://www.epa.gov/sites/production/files/2014-07/documents/mbd-epa-infrastructure.pdf
Jonathan Rose Companies; U.S. Environmental Protection Agency. (2011) Location Efficiency and Housing Type – Boiling it Down to BTUs.
https://www.epa.gov/smartgrowth/location-efficiency-and-housing-type Additional link: https://www.epa.gov/sites/production/files/2014-03/documents/location_efficiency_btu.pdf Additional link: https://kaidbenfieldarchive.com/20110224-households-in-transit-oriented-locations-save-more-ener.html
Ken R. Smith, PhD (U. of Utah) et al.; American Journal of Preventive Medicine. (2008) Walkability and Body Mass Index: Density, Design, and New Diversity Measures. https://www.ajpmonline.org/article/S0749-3797(08)00514-X/abstract Additional link: https://www.webmd.com/fitness-exercise/news/20080729/neighborhood-walkability-linked-to-weight#1
Kirk Erickson et al; University of Pittsburgh. (2011) Exercise training increases size of hippocampus and improves memory. http://www.pnas.org/content/108/7/3017.abstract
Knight Foundation & Gallup. (2011) Soul of the Community.
https://knightfoundation.org/sotc/
Kristine Engemann (Aarhus U., Denmark), et al.; Proceedings of the National Academy of Sciences (U.S.). (2019) Residential green space in childhood is associated with lower risk of psychiatric disorders from adolescence into adulthood. https://www.pnas.org/content/116/11/5188
L Andersen et al; Archives of Internal Medicine, 160, 1621-28. (2000) All-cause mortality associated with physical activity during leisure time, work, sports, and cycling to work.. https://www.ncbi.nlm.nih.gov/pubmed/10847255
Lawrence Frank; British Columbia School of Planning. (2007) Promoting Physical Activity Through Healthy Community Design.
http://health-design.spph.ubc.ca/research/previous-research/
Leandra Abarca-Gómez et al; World Health Organization; The Imperial College in London. (2017) Worldwide trends in body-mass index, underweight, overweight, and obesity from 1975 to 2016: a pooled analysis of 2416 population-based measurement studies in 128·9 million children, adolescents, and adults.
http://www.thelancet.com/journals/lancet/article/PIIS0140-6736(17)32129-3/fulltext
Lisa Nisenson; U.S. Environmental Protection Agency (EPA 231-B-05-002). (2005) Using Smart Growth Techniques as Stormwater Best Management Practices. https://nepis.epa.gov/Exe/ZyPDF.cgi?Dockey=2000E50E.PDF
Lynn Richards; U.S. Environmental Protection Agency (EPA 231-R-06-001). (2006) Protecting Water Resources with Higher Density Development. https://www.epa.gov/smartgrowth/protecting-water-resources-higher-density-development Additional link: https://www.epa.gov/sites/production/files/2014-03/documents/protect_water_higher_density1.pdf
Matti Lemmens. (2009) Re-Zoning Alberta: Smart Regulation for Smart Growth. https://heinonline.org/HOL/LandingPage?handle=hein.journals/mcgijosd5&div=7&id=&page=&t=1559257854
Melissa G. Kramer, Ph. D., et al.; U.S. Environmental Protection Agency, EPA 231K13001. (2013) Our Built and Natural Environments: A Technical Review of the Interactions Among Land Use, Transportation, and Environmental Quality (Second Edition). https://www.epa.gov/smartgrowth/our-built-and-natural-environments
Michael Sivak, Brandon Schoettle; Transportation Research Institute; The University of Michigan. (2016) Recent Decreases in the Proportion of Persons with a Driver’s License across All Age Groups.
http://www.umich.edu/~umtriswt/PDF/UMTRI-2016-4_Abstract_English.pdf
Mr. Money Mustache. (2011) The True Cost of Commuting. http://www.mrmoneymustache.com/2011/10/06/the-true-cost-of-commuting/
National Association of Realtors. (2015) NAR 2015 Community Preference Survey. http://www.realtor.org/sites/default/files/reports/2015/nar-psu-2015-poll-press-release.pdf
National Association of Realtors. (2017) NAR 2017 Community Preference Survey. https://www.nar.realtor/reports/nar-2017-community-preference-survey
National Recreation and Park Association. (2010) Synopsis of 2010 Research Papers: The Key Benefits. https://www.nrpa.org/uploadedFiles/nrpa.org/Publications_and_Research/Research/Papers/Synopsis-of-Research-Papers.pdf
National Transportation Safety Board; NTSB/SS-17/01 PB2017-102341. (2017) Reducing Speeding-Related Crashes Involving Passenger Vehicles.
https://www.ntsb.gov/safety/safety-studies/Documents/SS1701.pdf
New York City. (2016) Inventory of New York City Greenhouse Gas Emissions. https://www1.nyc.gov/assets/sustainability/downloads/pdf/publications/NYC_GHG_Inventory_2014.pdf
Office of Disease Prevention and Health Promotion. (2017) Healthy People 2020. https://www.healthypeople.gov/2020/data-search/midcourse-review/lhi
Omid Kardan (U. of Chicago), et al.; Nature: Scientific Reports. (2015) Neighborhood greenspace and health in a large urban center.
https://www.nature.com/articles/srep11610
Patrick Doherty, Christopher Leinberger; Brookings Institute. (2010) The Next Real Estate Boom.
https://www.brookings.edu/articles/the-next-real-estate-boom/
Peter James; Jaime Hart, Rachel Banay, Francine Laden; Environ Health Perspect 124:1344–1352. (2016) Exposure to Greenness and Mortality in a Nationwide Prospective Cohort Study of Women.
https://ehp.niehs.nih.gov/15-10363/
Peter Kokkinos. (2012) Physical Activity, Health Benefits, and Mortality Risk. https://www.ncbi.nlm.nih.gov/pmc/articles/PMC3501820/
Professor Mark Stevens (U. of British Columbia); Journal of the American Planning Association. (2017) Does Compact Development Make People Drive Less? https://www.tandfonline.com/doi/full/10.1080/01944363.2016.1240044 Additional link: https://www.huffpost.com/entry/meticulous-new-analysis-confirms-that-close-in-land_b_58c87e7fe4b05675ee9c5b5d Additional link: https://www.tandfonline.com/doi/full/10.1080/01944363.2016.1245112
Professors Reid Ewing (U. of Utah) and Robert Cervero (UC-Berkeley); Journal of the American Planning Association. (2010) Travel and the Built Environment: A Meta-Analysis. https://www.tandfonline.com/doi/abs/10.1080/01944361003766766 Additional link: https://kaidbenfieldarchive.com/20100604-the-definitive-study-of-how-land-use-affects-travel-beh.html
Project for Public Spaces. (2016) The Case for Healthy Places: Improving Health Outcomes Through Placemaking.
https://www.pps.org/wp-content/uploads/2016/12/Healthy-Places-PPS.pdf
Purdue University. (2017) People for Bikes: Health Statistics.
http://peopleforbikes.org/our-work/statistics/
Rahul Kumar, Vimal Mishra; Indian Institute of Technology Gandhinagar; Buzan, Jonathan; Huber, Matthew; Purdue University; Kumar, Rohini; UFZ-Helmholtz Centre for Environmental Research; Shindell, Drew; Duke University. (2017) Dominant control of agriculture and irrigation on urban heat island in India.
https://www.nature.com/articles/s41598-017-14213-2
Raj Chawla; Ted Wannell; Statistics Canada. (2005) Spenders and Savers. http://www.statcan.gc.ca/pub/75-001-x/10305/7797-eng.pdf
Redfin. (2016) How Much is a Point of Walk Score Worth?. https://www.redfin.com/blog/2016/08/how-much-is-a-point-of-walk-score-worth.html
Reid Ewing, Keith Bartholomew, Steve Winkelman, Jerry Walters, Don Chen; Urban Land Institute, Smart Growth America, Center for Clean Air Policy, National Center for Smart Growth Research & Education, University of Utah. (2008) Growing Cooler: The Evidence on Urban Development and Climate Change.
https://uli.bookstore.ipgbook.com/growing-cooler-products-9780874201789.php Additional link: http://old.smartgrowthamerica.org/documents/growingcoolerCH1.pdf
Richard Bernhardt; City of Nashville, Tennessee. (2013) Nashville, Tennessee Form-Based Code.
http://www.cvilletomorrow.org/news/article/25049-nashville-planner-on-form-based-zoning/
Robert Putnam. (2000) Bowling Alone.
http://bowlingalone.com/
Rodney H. Matsuoka (doctoral dissertation, U. of Michigan). (2008) High School Landscapes and Student Performance. https://deepblue.lib.umich.edu/bitstream/handle/2027.42/61641/rmatsuok_1.pdf
Roger Ulrich; Science. (1984) View through a window may influence recovery from surgery. http://science.sciencemag.org/content/224/4647/420
Rudy Sinharay, MBBS (National Heart and Lung Institute and MRC-PHE Centre for Environment and Health, Imperial College, London, UK); The Lancet. (2018) Respiratory and cardiovascular responses to walking down a traffic-polluted road compared with walking in a traffic-free area in participants aged 60 years and older with chronic lung or heart disease and age-matched healthy controls: a randomised, crossover study. https://www.thelancet.com/journals/lancet/article/PIIS0140-6736(17)32643-0/fulltext Additional link: https://www.pri.org/stories/2018-01-07/when-it-comes-walking-park-or-down-city-street-study-finds-not-all-exercise
Russ Lopez; Boston University School of Public Health. (2003) Urban Sprawl and Risk for Being Overweight or Obese.
http://ajph.aphapublications.org/doi/abs/10.2105/AJPH.94.9.1574
S. Nicholls, J.L. Crompton, National Recreation and Parks Association; Journal of Leisure Research. (2005) The Impact of Greenways on Property Values: Evidence from Austin, Texas.
http://www.nrpa.org/globalassets/journals/jlr/2005/volume-37/jlr-volume-37-number-3-pp-321-341.pdf
Scott Bernstein; Center for Neighborhood Technology. (2015) H+T Affordability Index. https://htaindex.cnt.org
SGS Economics & Planning; City of Melbourne, Australia. (2018) City of Melbourne’s Transport Strategy.
https://www.sgsep.com.au/news/latest-news/economics-walking-deserves-far-more-attention
Shannon Rogers, John Halstead, Kevin Gardner, Cynthia Carlson; University of New Hampshire. (2010) Examining Walkability and Social Capital as Indicators of Quality of Life at the Municipal and Neighborhood Scales.
https://link.springer.com/article/10.1007/s11482-010-9132-4
Simon Hay et al; The Lancet, Volume 390, Issue 10100, 1260 - 1344. (2017) Global, regional, and national disability-adjusted life-years (DALYs) for 333 diseases and injuries and healthy life expectancy (HALE) for 195 countries and territories, 1990–2016: a systematic analysis for the Global Burden of Disease Study 2016. http://www.thelancet.com/journals/lancet/article/PIIS0140-6736(17)32130-X/fulltext
Siteline Institute. (2018) Little Big Shift.
https://www.sightline.org/2018/11/15/portland-traffic-capacity-proposal-city-council-vote/
Smart Growth America and RCLCO for PlaceMakers, DPZ, CNT, and Doña Ana County. (2017) Doña Ana County, New Mexico.
https://www.vivadonaana.org/
Smart Growth America and the National Complete Streets Coalition. (2019) Dangerous by Design.
https://smartgrowthamerica.org/resources/dangerous-by-design-2019/ Additional link: http://bit.ly/SoPSGADBD
Smart Growth America; Cushman & Wakefield; George Washington University School of Business’ Center for Real Estate and Urban Analysis. (2015) Core Values: Why American Companies are Moving Downtown.
https://smartgrowthamerica.org/resources/core-values-why-american-companies-are-moving-downtown/
Smart Growth America. (2013) Building Better Budgets. https://smartgrowthamerica.org/resources/building-better-budgets-a-national-examination-of-the-fiscal-benefits-of-smart-growth-development/
Smart Growth America. (2016) Foot Traffic Ahead. https://smartgrowthamerica.org/resources/foot-traffic-ahead-2016/
Smart Prosperity Institute. (2013) Suburban Sprawl: Exposing Hidden Costs, Identifying Innovations.
http://thecostofsprawl.com
Susan Shaheen. (2014) Transportation Sustainability Research Cente. https://www.scientificamerican.com/article/is-bike-sharing-really-climate-friendly/
T. Endrenya, R. Santagatab, A. Pernab, C. DeStefanob R. F. Rallob, S. Ulgiatib; Ecological Modeling. (2017) Implementing and managing urban forests: A much needed conservation strategy to increase ecosystem services and urban wellbeing. https://www.sciencedirect.com/science/article/pii/S0304380017300960
The Alliance for Biking & Walking. (2016) Bicycling & Walking in the United States 2016 Report.
https://www.aarp.org/content/dam/aarp/livable-communities/documents-2016/2016-WalkingBicyclingBenchmarkingReport.pdf
The Nature Conservancy. (2017) Funding Trees for Health.
https://thought-leadership-production.s3.amazonaws.com/2017/09/19/15/24/13/b408e102-561f-4116-822c-2265b4fdc079/Trees4Health_FINAL.pdf
The Transportation Research Board; National Academy of Sciences, Engineering, and Medicine. (2010) Driving and the Built Environment. http://www.trb.org/Publications/Blurbs/Driving_and_the_Built_Environment_The_Effects_of_C_162093.aspx
U.S. Department of Agriculture, Forest Service. (2018) Urban & Community Forestry Program. https://www.fs.fed.us/ucf/supporting_docs/UCF-Brief-Feb2018.pdf
Utah Transit Authority; Urban Design 4 Health, Inc.; Fehr and Peers; HDR Engineers. (2017) Economic Impacts of Active Transportation: Utah Active Transportation Benefits Study. https://bikeutah.org/wp-content/uploads/2017/03/Utah-Active-Transportation-Benefits-Study-Final-Report.pdf
To recommend additional works for consideration to be added to Code Score, please leave a comment on the Code Score Google Sheet.

Code Score by Hazel Borys and Kaid Benfield is licensed under a Creative Commons Attribution-NonCommercial-ShareAlike 3.0 Unported License. Based on work at CodeScore.org.